
Help & FAQs
» Help
» Mandatory requirements
- All the files submitted to the webtool MUST be in plain text ( e.g. ".doc" or ".rtf" files are not accepted ).
- The data tables (ToC, DEt) submitted to the webtool MUST have the headers that identify the different columns as in the examples: ToC and DEt.
- For FASTA input files, the following extensions will be recognized by our tool ( .fasta, .fa, .faa, .fas, .fna, .sequences, .txt ). If your FASTA file has any other extension, it MUST be renamed to any of the mentioned ones ( e.g. Sequences.other -> Sequences.fasta ).
» Prokaryotic secretion tool
The species that can be studied with PECAS Prokaryotic secretion tool are any of the gram-positive and gram-negative bacteria.
The complete secretome analysis for prokaryotes is presented in a single step interface.
In this pipeline only FASTA files are allowed as input. (example)
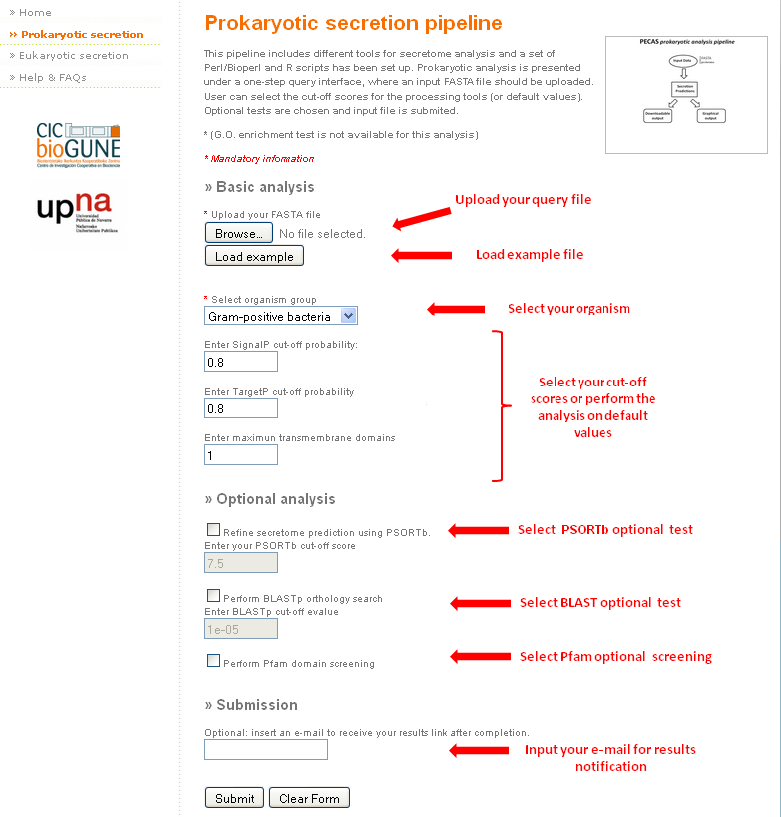
How to use the basic secretion tool:
- First of all, complete the mandatory fields:
- Upload the FASTA file.
- Select if the organism is a Gram-positive or a Gram-negative bacteria.
- After this, you can change the cut-off values offered in the web by default (click here to read about the different cut-off values).
- If you wish to receive the results by email, just enter a valid e-mail address in the corresponding submission field. Otherwise, you can download them from the link displayed on the screen.
Apart from the basic analysis, you can select to perform three extra analyses: filtering the predicted proteins by subcellular location using PSORTb, the BLASTp orthology search and the Pfam domain screening. For that, just click on the appropriate selector and change the cut-off value if necessary.
In case you want to perform a dummy test on PECAS Prokaryotic pipeline, the example file can be automatically uploaded.
» Eukaryotic secretion tool
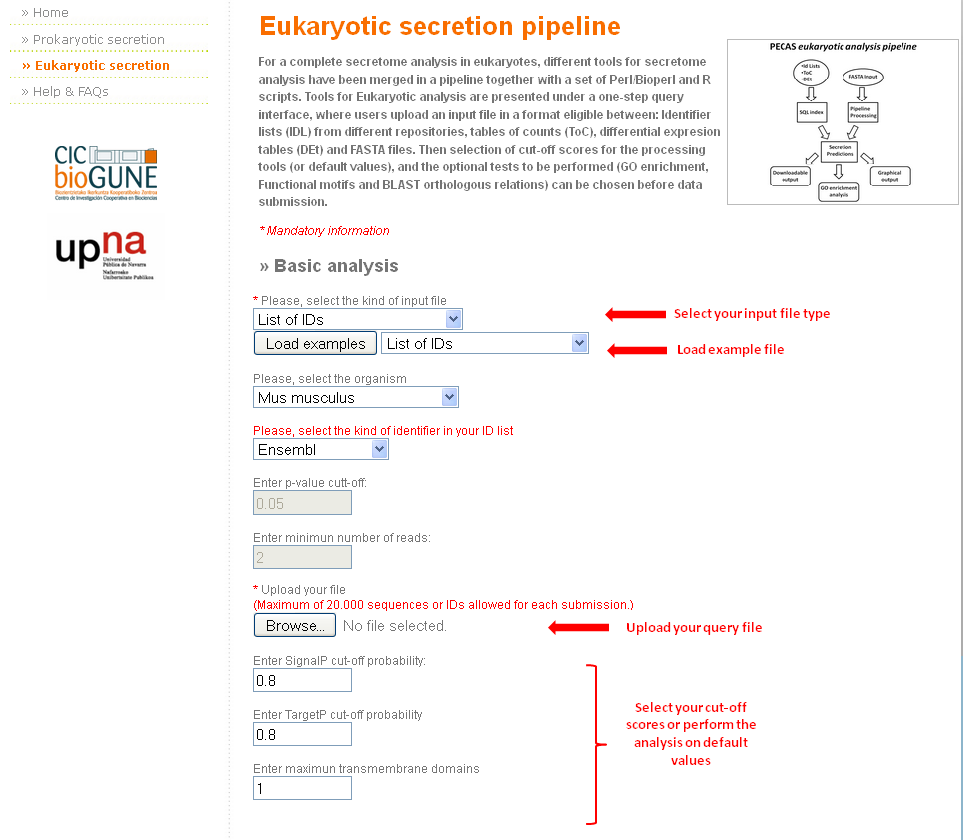
In order to perform a complete secretome analysis for a eukaryote organism in an intuitive and user friend manner, we developed a single step query interface.
To improve tool's operability multiple types of input files are accepted:
- FASTA files (example) Warning: Following input file options are only available for all the organisms included within ENSEMBL list of released asemblies.
- Identifier lists (IDL) from different repositories (example)
- Tables of counts, with just one column (ToC) (example)
- These tables MUST have one first column featuring gene names and a second showing the number of read counts aligned to that gene
- Gene annotations accepted are Entrezgene and ENSEMBL
- Differential expression tables (DEt) (example)
- DEt MUST have one column named "id" where gene names are listed
- Our tool will crash if the input includes values like #NAME? that are not recognized by the R modules in which the tool is based on
The basic usage of the tool is very similar for all kind of inputs, although there are some minor differences:
- First of all, complete the mandatory fields:
- Select the kind of input type, the extra fields that are required for every case will be highlighted in red.
- Upload the file to be analyzed
- Then, the cut-off values are selected or the analysis can be performed on default values (click here to read about the different cut-off values).
- If the user wishes to receive the results by email, a valid e-mail address should be entered in the specific field. Otherwise, results can be downloaded from the link displayed on the screen after completion.
Particularities of the different input files submission:
- For FASTA files, there is no need of selecting the organism of interest. So, this selector will be disabled.
- The analysis of FASTA files is different. Due to this, the GO enrichment analysis is not available for this kind of inputs.
- For ToC input files, it is necessary to determine a minimum number of reads as cut-off. By default this number is 2.
- For DEt input files, it is necessary to determine a maximum p-value as cut-off. By default this number is 0.05.
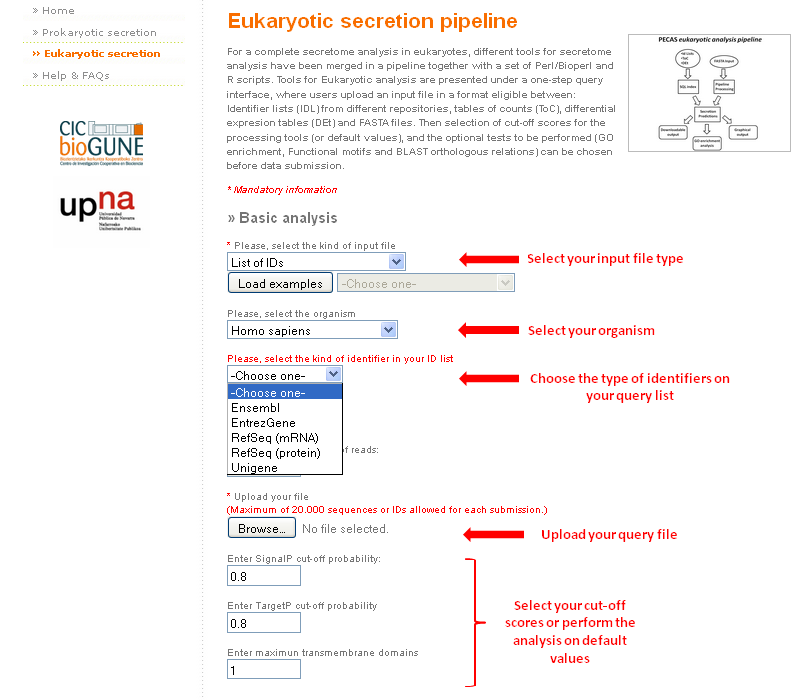
- In the case of using the list of IDs as input, users will have to choose the type of identifier on the query list. See the picture below.
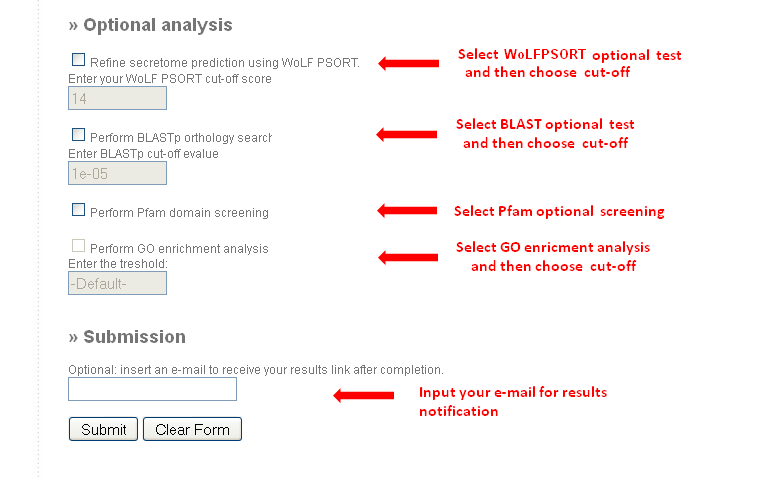
Apart from the basic analysis, you can optionally perform four extra ones: filtering by subcellular location using WoLF PSORT, the BLASTp orthology search, the Pfam domain screening and the Gene Ontology (GO) enrichment analysis. If interested, just click on the appropriate selector and change the default cut-off values if required.
PECAS performs two different kinds of GO analysis for eukaryote species whose GO annotation is available, i.e.:
Bos taurus, Canis lupus, Danio rerio, Gallus gallus, Mus musculus, Rattus norvegicus, Homo sapiens, Pan troglodytes, Drosophila melanogaster, Caenorhabditis elegans, Sus scrofa and Saccharomyces cerevisiae
- When the input contains quantitative data for each gene/protein/sequence Id, (i.e. DEt or ToC input files), the measured
criteria (p-value and number of reads) can be used as cut-off for the enrichment analysis (DEt, ToC).
In these cases, a default value is loaded, but it is recommended that the user defines a custom cut-off value.
- Default value in case of a DEt input file: pvalue < 0.01
- Default value in case of a ToC input file: # of reads > 2
- When the input is a simple ID list with no associated values, a cuf-off criterion is obtained through a randomization step, and therefore, the assignment of cut-off value is not needed.
In case one wants to perform a dummy test on PECAS Eukaryotic pipeline, several example files can be automatically uploaded.
» Results
The results obtained after the analyses have been performed are organized in a general way for both types of approaches, with minor differences.
The results of the basic analyses (prokaryotic and eukaryotic) are output in two parts.
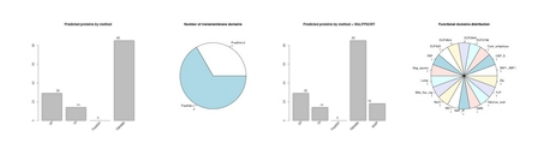
- The first is a graphical representation of the data obtained during the process:
- A first barplot, showing how many secreted proteins were found by each of the tools used.
- A pie chart, which represents the number of transmembrane domains calculated for each particular data set.
- A second barplot: this plot illustrates how many secreted proteins were found by each of the tools used in contrast with the results obtained by the WoLFPSORT, which detects the extracellular proteins.
- A second pie chart:showing the different structural domains that are present among the proteins predicted as secreted .
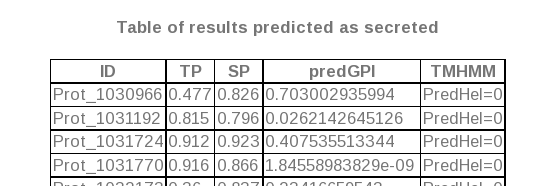
- The second part consists in a table that shows the basic information of the secreted proteins. This table presents some differences depending on the input file uploaded to the tool.
- In the case a FASTA file is uploaded (both for prokaryotic and eukaryotic FASTA file analysis), the resulting table is formed by the following columns: The first of them is the ID of the fasta
sequence predicted as secreted, and the next ones are the values yielded for this protein in all the tools used to perform the prediction (TargetP, SignalP, predGPI and TMHMM in both cases,
and also LipoP in prokaryotic analyses).
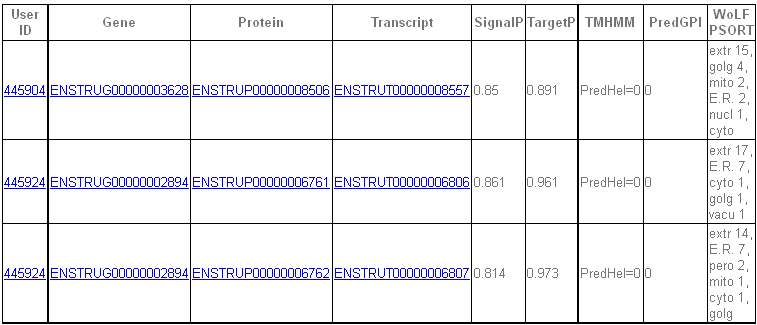
- In the rest of cases (i.e. ToC, DEt and ID lists at the eukaryotic pipeline) the resulting table presents a more complete information about each protein predicted as secreted. Apart from the
records described in the previous case, this table also gives a set of links to the corresponding webpages for an easy access to further information.
- In the case a FASTA file is uploaded (both for prokaryotic and eukaryotic FASTA file analysis), the resulting table is formed by the following columns: The first of them is the ID of the fasta
sequence predicted as secreted, and the next ones are the values yielded for this protein in all the tools used to perform the prediction (TargetP, SignalP, predGPI and TMHMM in both cases,
and also LipoP in prokaryotic analyses).
- The third and last part of the results outputs the information obtained from the selected optional analyses.
- In case a BLASTp search has been chosen, a specific link is enabled to download the results table.
- As in the previous case, if a Pfam domain screening has been chosen, a specific link is facilitated to download the results table. Also the results web page will contain an additional pie chart in which the distribution of identified functional domains is displayed.
- Furthermore, a graph with the protein-protein interaction and the results table are available.
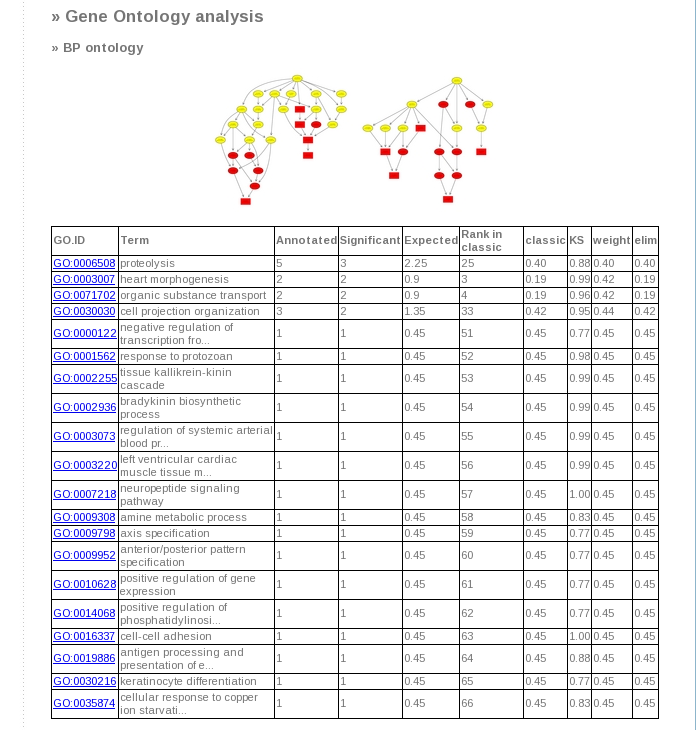
- Finally, in case GO enrichment has been chosen, the resulted tables and graphs will be displayed. This analysis will yield a
total of 6 graphs, being 2 per each kind of enrichment performed (Biological Process (BP), Cell Component (CC) and Molecular
Function (MF)): one contains Fisher test statistics and the second Kolmogorov-Smirnov test. In addition, a table that
summarized all the GO results is provided.
Graphical output interpretation: Boxes indicate the 10 most significant terms. Box color represents the relative significance,ranging from dark red (most significant) to light yellow (least significant). Black arrows indicate is-a relationships and red arrows part-of relationship.
» Downloadable results
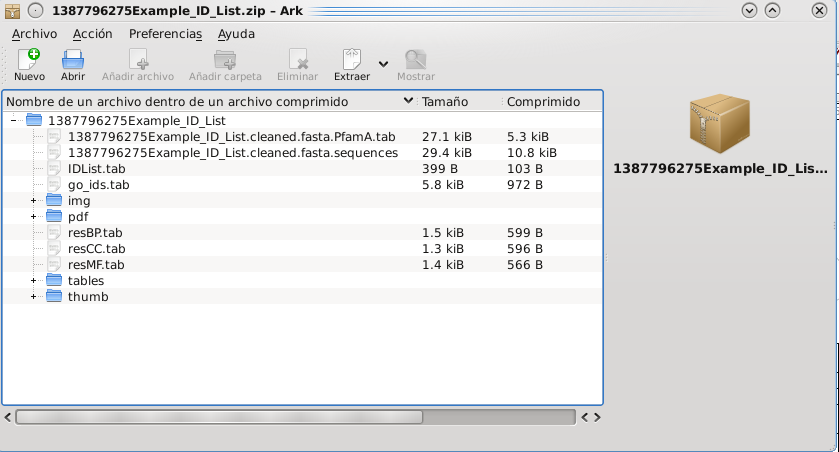
Finally, at the bottom of the web page there is a link from which the results can be downloaded. This link will provide a compressed zip file containing:
- "img" folder: all the images displayed in the website in full size.
- "thumb" folder: the images mentioned before, but at small scale.
- "PDF" folder: the same graphs in PDF format.
- "tables" folder: tables with the information found for the predicted proteins:
- ShortTable.xls: It encloses the information shown on the results webpage.
- File "input_FILE_NAME.Sequences": sequences in FASTA format of the predicted proteins.
- File "proteinIDList.tab": list of protein IDs predicted as secretory from to the user input.
- File "userIDList.tab": list of the user input identifiers predicted as secretory proteins.
Optional files that can be found:
- File "input_FILE_NAME.PfamA.tab": results from the Pfam analysis.
- File "input_FILE_NAME.out": obtained after alignment of the sequences of predicted secreted proteins using BLASTp.
- Files "resBP.tab", "resCC.tab" and "resMF.tab": results of GO enrichment analysis.
- File "user_ensemblGene_GO_ids.tab": relationships between the IDs provided by the user and their GO values.